
Until now, the way you found out that something was wrong with your app on Granite was usually your users. A healthcheck could fail for an hour, a worker could sit in a crash loop overnight, and the dashboard would still show a green "deployed" status, because the last deployment really had succeeded.
That changes today. Granite now watches every resource of your application and tells you when something goes wrong, and when it is fixed. You get it in three places: an event log in the dashboard, webhooks to your own endpoint, and alert emails. The same events are available in the CLI and in our Claude Code skill.
What Granite watches
A small agent runs in every Granite cluster and watches your containers directly. When it sees a problem, it reports it:
- Healthcheck failing: the healthcheck of a running container keeps failing. The event carries the probe's own message, e.g.
HTTP probe failed with statuscode: 503. - Down and Degraded: no replica, or only some replicas, of a web app or worker are ready.
- Crash loop: a container keeps crashing and Kubernetes is backing off before the next restart.
- Out of memory: a container was killed for using more memory than its limit, with the limit in the event.
- Image pull failed: a missing tag, a private image without credentials, expired registry credentials.
- Configuration error: the container cannot be created or started, for example because its command does not exist.
- Restarted: a container was restarted, and why (liveness probe, error exit, normal exit).
- Cron runs: a run failed (with its exit code), succeeded, or is still running when the next one is due.
The platform itself adds deployment events: started, succeeded, failed, canceled, and build failed for Build from Source.
Most problems come in pairs: one event when the problem starts and another when it is over, like resource.down and resource.up. Both are debounced, so a two-second blip during a restart does not wake anyone up: a problem is reported after it lasts 30 to 60 seconds, a recovery after the resource has been healthy for 2 minutes. And while a deployment is rolling out, new containers that fail to start are reported once, as Deployment failed, rather than as a storm of healthcheck events.
The Events tab
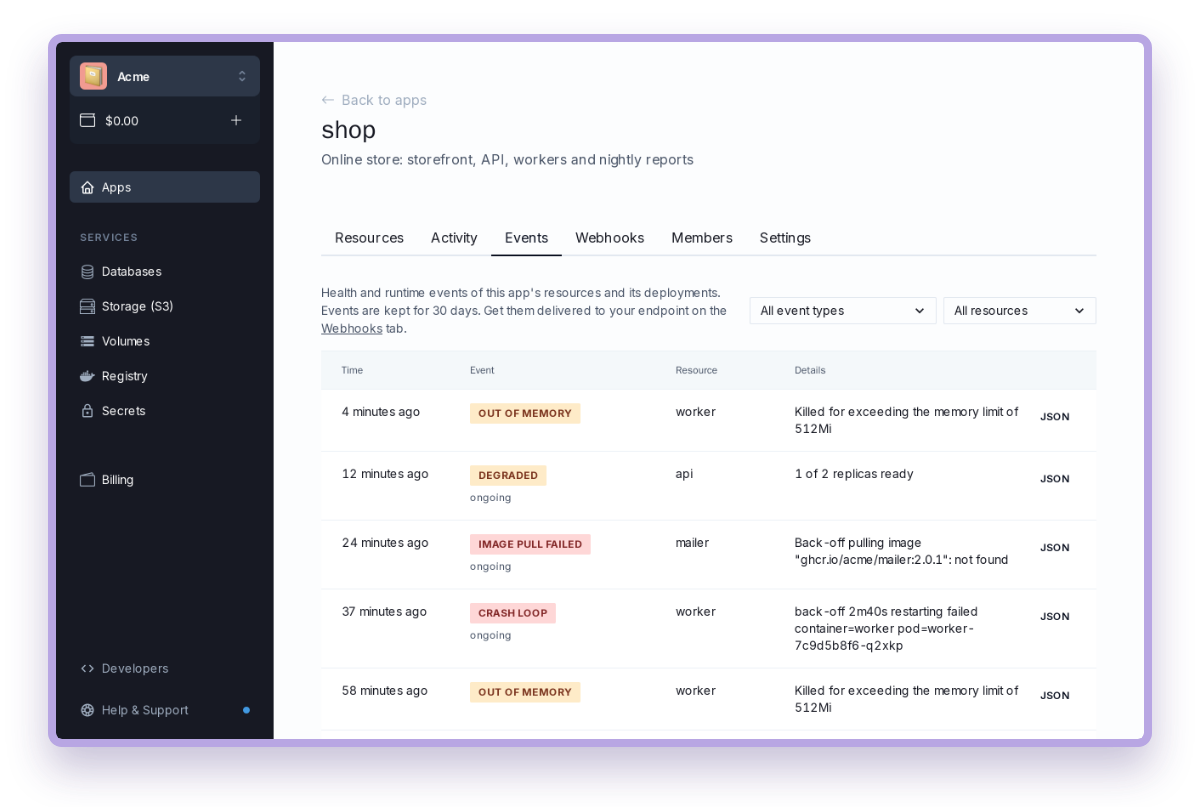
Every application now has an Events tab. It lists what happened over the last 30 days, filterable by event type and resource, and refreshes on its own. Problems that are still open are marked ongoing, so you can tell at a glance whether that resource.down from this morning is history or still happening. The JSON button shows each event exactly as a webhook receives it.
Webhooks
On the Webhooks tab you can add up to three HTTPS endpoints per application. Each one can receive all events or just the types you pick, for all resources or selected ones. Point one at your incident tool, a chat bot, or your own automation.

Requests follow the Standard Webhooks specification: every request is signed with HMAC-SHA256 using a whsec_ secret that is shown once when you create the webhook. Any Standard Webhooks library can verify it, and the docs have ready-to-paste verification code for Node.js, Python and Go.
A few details that matter in practice:
webhook-idis the event ID and stays the same on every retry, so deduplicating is trivial.- A failed delivery (non-2xx, timeout or connection error) is retried after 30 seconds, 2 minutes, 10 minutes, 30 minutes, 1 hour and 3 hours.
- Recent deliveries shows every attempt with the response code and the start of the response body, and Redeliver sends one again.
- Send test event lets you check your endpoint before anything real happens.
- A webhook that has failed 20 times in a row, with no successful delivery for 3 days, is switched off automatically and marked with the reason, so a dead endpoint doesn't keep piling up retries.

Alert emails, on by default
Not everyone runs an incident tool, and a webhook is one more thing to set up. So every project now gets alert emails to its contact email, with nothing to configure.
Emails cover problems and their recoveries: failing healthchecks, resources going down and back up, OOM kills, crash loops, image pull and configuration errors, failed cron runs, and failed deployments and builds. Routine events such as restarts, successful cron runs and deployment progress stay on the Events tab.
To keep your inbox usable, events are grouped per application. The first email goes out about 2 minutes after a problem starts, so a failing healthcheck and the resource going down arrive together, and after that an application sends at most one email every 30 minutes. You can turn alert emails off, or send them to a different address, in Project settings.

Events in the CLI
novps CLI v0.9.0 adds novps apps events:
novps apps events <app_id>                         # the latest events
novps apps events <app_id> --since 6h -r web       # one resource, last 6 hours
novps apps events <app_id> -t deployment.failed    # one event type
novps apps events <app_id> -f                      # keep printing new events
novps apps events <app_id> --json                  # for scripts
With -f it keeps printing new events as they happen, which is handy in a terminal next to a deploy. Open problems are marked (ongoing). The same data is available from the public API at GET https://api.granite.so/apps/{app_id}/events with a personal access token.
Install or update the CLI with:
curl https://cli.granite.so | shThe Claude Code skill knows about it too
Our Claude Code skill lets you deploy and operate Granite apps by asking Claude: "deploy this to Granite", "tail the prod logs". It now starts every investigation with the event log.
Ask it "why is my API down?" and, instead of scrolling logs first, it runs novps apps events <app_id> --since 1h. That tells it which resource failed, how (OOM with the memory limit, crash loop, healthcheck status code, image pull error), and whether the problem is still ongoing. Only then does it move on to the resource status and logs. It also knows that an OOM kill means a bigger replica size, not more time in the logs.
To install the skill for all your projects:
mkdir -p ~/.claude/skills
git clone https://github.com/granite-so/claude-skill ~/.claude/skills/novps
If you already have it, git pull in that directory picks up the update.
Get started
Nothing to enable: events are already being recorded for your applications, and alert emails are going to your project's contact email. Open any application and check the Events tab, or add a webhook on the Webhooks tab. The details are in the docs: application events, webhooks and alert emails.
As always, we'd love to hear what you think, and which events you'd like us to add next.